Reviews
Part of What genuine smart yard case studies teach, once the marketing is stripped out
Reading a smart yard case study in 2027: denominator, period, and method
How to read numbers in a smart yard case study: check the denominator, the period, the measurement method, and whether the figure is modeled or metered.
Numbers in case studies fail in predictable ways. A percentage without a denominator. A saving measured across a wetter year. A modeled figure presented as a measurement. A national total quoted as if it applied to one property. This article gives the checks that catch each, in the order they are worth applying.
What to take away
- Always find the denominator. A percentage of an unstated baseline is not a result.
- Check the period, and check whether the weather in it was comparable.
- Separate modeled figures from metered ones. Both are useful; only one is a measurement.
- National totals describe the country, not your property, and they are the most misquoted numbers in this field.
Check one: the denominator and the period
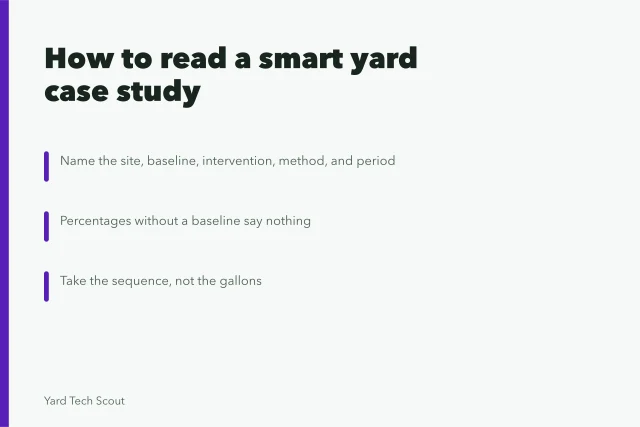
Ask what the percentage measures, over which months, and against what comparison period. A 30 percent reduction against the same three months last summer, measured at the meter, means something.
The same figure against a modeled hypothetical schedule means less. Against an unstated baseline it means nothing. If the document does not name which of the three, treat the number as decoration and read the rest for method.
Check two: national totals are not personal figures
Aggregate numbers describe a problem at national scale and get misused constantly. EPA's overview of nonpoint source pollution from agriculture is a well-framed aggregate.
US agriculture land by use
- 1.2 billionacres in agriculture
- 330 millionacres of row crops
- 655 millionacres of pasture and rangeland
- 130 millionacres of grazed forestland
It reports that nearly 1.2 billion of the nation's 2.3 billion acres are devoted to agriculture: roughly 330 million acres of row crop land, 655 million acres of pasture and rangeland, and 130 million acres of grazed forestland. Activities on working farms can affect water quality locally and across multi-state watersheds.
Those figures describe the country. They tell you nothing about any individual farm, and a case study that slides from a national total to a site-level claim has made an error you should catch.
Check three: where the number came from
Programs say how figures are produced, and categories are worth learning. EPA's summary of its efforts to reduce nutrient pollution sorts its work into partnering with stakeholders, technical and programmatic support to states, tribes, and territories, overseeing regulatory programs, financing reduction activities. It lists research and development and outreach.
Numbers from a research activity, a regulatory program, and an outreach campaign are not the same kind of number, and they should not be compared as though they were.
The checklist to apply
Question / If unanswered
- Percentage of what?
- Discard the figure
- Over which months?
- Treat as unverified
- Metered or modeled?
- Assume modeled
- What else changed?
- Assume something did
- Who paid for the study?
- Not disqualifying, but read the method twice
- Is the site comparable to mine?
- Usually not, so take the method instead
Using what survives
What usually survives these checks is not a number but a sequence, and a sequence is more useful anyway. Apply the same skepticism to product specifications using our guide to reading published specs, and judge the document as a whole against our guide to reading case studies.